Residential Market Activity
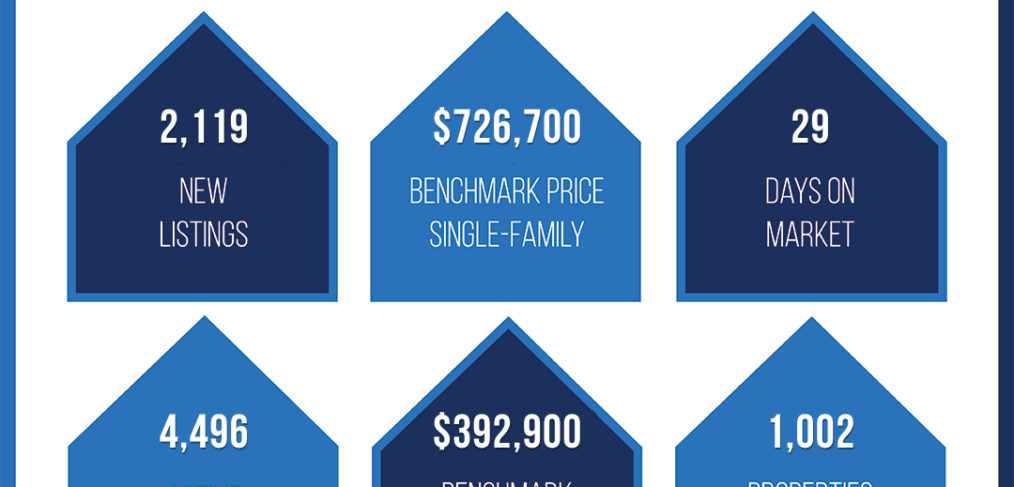
A total of 1,002 homes were sold through the MLS® System in August, down 18.6% from August 2025. Sales also declined 24.4% from July. By comparison, the median July-to-August decline over the previous 10 years was 5.8%, confirming that this year’s slowdown was substantially larger than normal seasonal variation. The August total tied 2022 for the lowest August sales count since 2016.
The sales decline extended across all three major property types:
This broad-based weakness differs from earlier months, when the softer activity was more concentrated in townhouses and apartments.
Year to date, 9,283 homes have sold in Ottawa, down 6.9% from the same period in 2025. The year-to-date shortfall widened from 5.2% at the end of July, reversing the incremental improvement recorded last month. Total year-to-date dollar volume was approximately $6.5 billion, down 7.2% year over year.
Prices and Market Balance
The average residential sale price was $688,253 in August, up 0.3% from a year earlier and 0.7% from July. The median price was $622,357, down 1.2% year over year and 2.0% from July.
The MLS® Home Price Index, a measure less affected by changes in the types of properties sold, recorded a composite benchmark price of $637,700. This was 1.0% higher than in August 2025 and 0.6% higher than in July. Taken together, the price measures indicate that values were considerably steadier than sales activity.
There were 2,119 new listings in August, unchanged from a year earlier and down 16.2% from July. Active listings totalled 4,496, up 11.3% year over year but down 3.9% from July. The monthly declines in new and active listings were broadly consistent with seasonal patterns, but active inventory remained at its highest August level since 2016.
The decline in active listings should not be interpreted as inventory being absorbed primarily through sales. An OREB review of listing records indicates that terminations, cancellations and expirations became more prominent relative to completed transactions through the summer. Although these non-sale removals declined from July, sales fell more sharply, meaning a greater proportion of properties left the market without producing a sale. One explanation for this behaviour could be that some sellers may be stepping back or reassessing their plans to sell under current conditions.
The sales-to-new-listings ratio fell from 52.4% in July to 47.3% in August as sales declined faster than new listings. Months of inventory increased from 3.5 to 4.5. Over the previous 10 years, the median July-to-August change in months of inventory was zero, and no increase exceeded 0.4 months. This year’s one-month jump in MOI therefore represents a meaningful weakening in absorption rather than a typical summer movement.
Other transaction measures changed only modestly. Homes sold for an average of 97.9% of their listing price, unchanged from August 2025, while the median time on market increased from 28 days last August to 29 days. These figures remain consistent with broadly balanced conditions, despite the softening of other indicators.
Single-family homes remained the most stable major segment. The single-family benchmark price rose 2.2% year over year, while months of inventory reached 4.0. Townhouses recorded 4.1 months of inventory, with active listings 27.1% above last year and a benchmark price 4.0% lower year over year. The weakening of the townhouse market is something worth monitoring closely.
Of all the property segments, apartment conditions remained the softest in August, continuing the pattern observed throughout 2026 and the second half of 2025. Apartments recorded 6.3 months of inventory, a 43.0% sales-to-new-listings ratio and a median of 42 days on market. However, active apartment listings declined from July, the sales-to-new-listings ratio improved slightly, and the apartment benchmark rose 1.9% month over month. The August figures therefore show continued softness, but not a decisive new deterioration.