Ottawa Real Estate Board Market Update for July 2026
Ottawa Home Sales Hold Steady as New Listings Ease in July
Market Overview
Ottawa’s resale housing market remained steady in July. Sales were almost unchanged from a year earlier, while fewer new listings helped improve the balance between incoming supply and demand. Buyers continued to have more choice than in recent years, with conditions varying considerably by property type and neighbourhood.
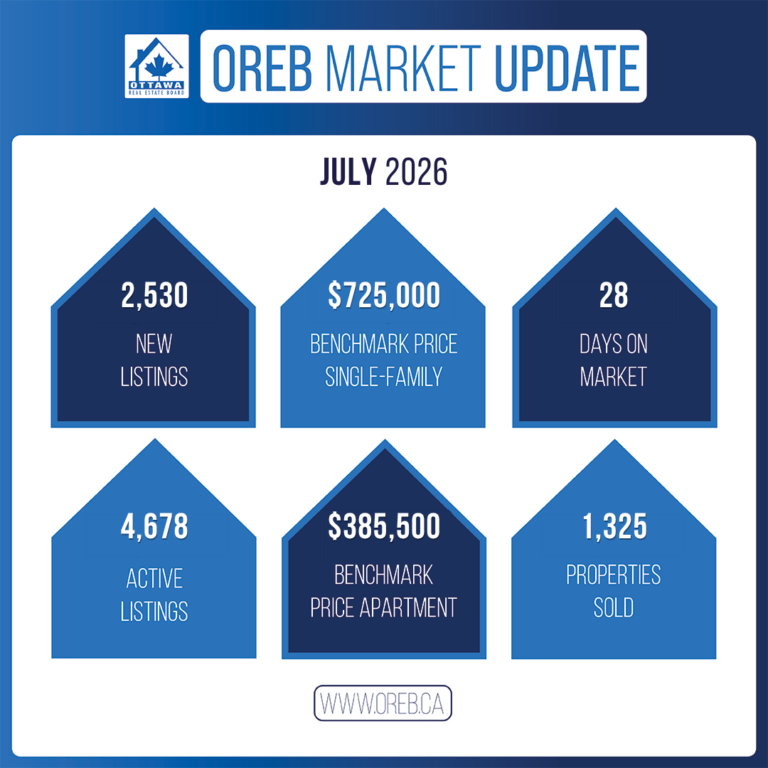
The Ottawa Real Estate Board (OREB) reported 1,325 residential sales through the MLS® System, up 0.2% from July 2025. Sales fell 12.7% from June—a smaller seasonal decline than the 20.7% median June-to-July decrease over the previous decade.
Prices told a similarly measured story. The average sale price declined 1.6% year over year, but the median was unchanged and the composite benchmark moved only slightly. The mix of properties sold matters when interpreting the headline average.
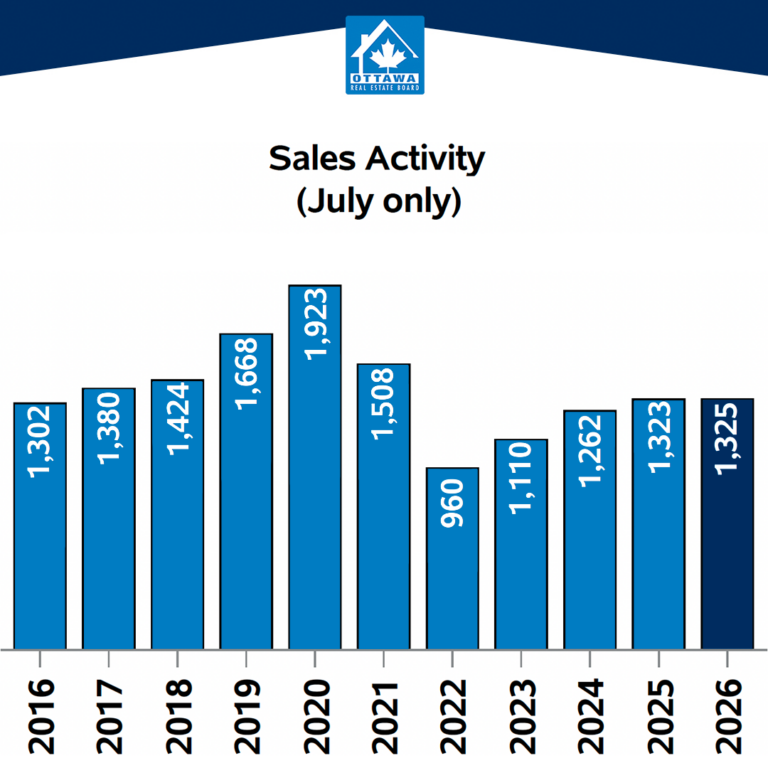 Sales were almost unchanged from July 2025. Source: OREB.
Residential Market Activity
Single-family homes remained the strongest of the three major property segments, recording 714 sales, up 5.0% from July 2025. Townhouses recorded 417 sales, down 4.1%, while apartment sales totalled 169, down 6.6%.
OREB reported 8,288 sales for the year to date, down 5.2% from the same period in 2025. The year-to-date shortfall narrowed from the 6.1% reported at the end of June. Year-to-date dollar volume was approximately $5.8 billion, down 5.6%.
Prices and Market Balance
- Average residential sale price: $683,308, down 1.6% year over year.
- Median residential sale price: $635,000, unchanged year over year.
- MLS® HPI composite benchmark price: $634,000, down 0.5% year over year and up 0.3% from June.
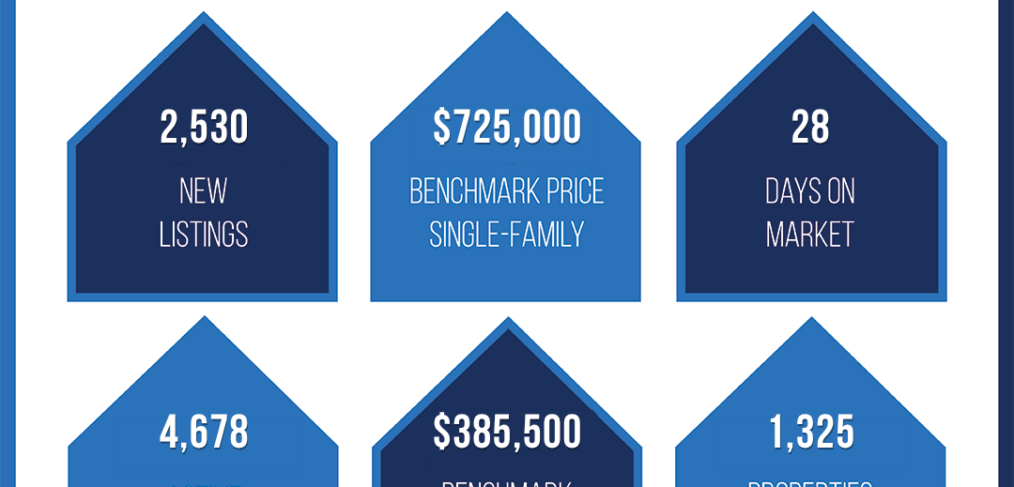
- New listings: 2,530, down 0.8% year over year.
- Active listings: 4,678, up 9.3% year over year and down 6.1% from June.
The sales-to-new-listings ratio rose from 48.8% in June to 52.4% in July. This indicates that sales absorbed a larger share of incoming listings. Months of inventory nevertheless edged up from 3.3 to 3.5 as sales slowed seasonally.
These measures describe different aspects of the market: the sales-to-new-listings ratio compares sales with newly listed homes, while months of inventory compares the available stock of listings with the pace of sales. An improvement in one does not necessarily mean the other will tighten in the same month.
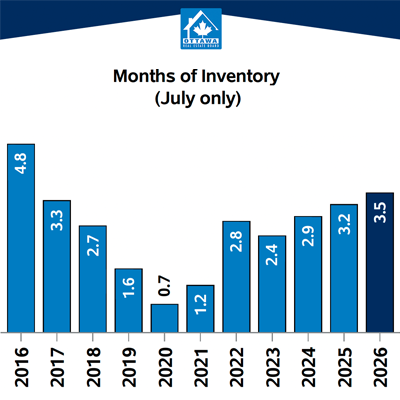 July inventory: 3.5 months, compared with 3.2 a year earlier. Source: OREB.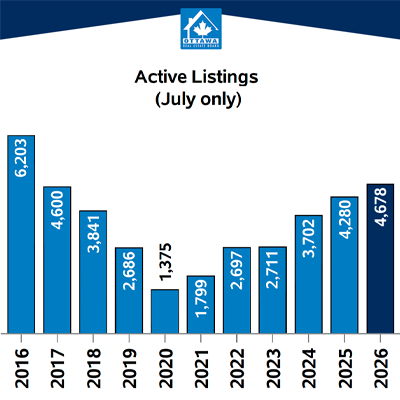
Homes sold for an average of 97.8% of their listing price, compared with 98.0% in July 2025. Median time on market increased from 24 to 28 days. Together, these figures point to improved absorption of new supply, without a broad shift toward tighter selling conditions.
Different Conditions by Property Type
Single-family homes recorded 3.2 months of inventory. Their benchmark price was $725,000, up 0.6% year over year. This is the single-family benchmark, distinct from the $634,000 composite benchmark for the overall market.
Townhouses had 3.0 months of inventory and a sales-to-new-listings ratio of 55.9%. Their benchmark price remained 5.1% below July 2025.
Apartments continued to face softer conditions, especially downtown. They recorded 5.4 months of inventory, a 41.0% sales-to-new-listings ratio and a median of 41 days on market. The apartment benchmark price was $385,500, down 5.2% year over year.
Regional Market Comparison
Ottawa’s suburban markets accounted for more than 70% of residential sales. In Ottawa Suburb South, sales rose 8.0% year over year while new listings fell 6.6%, bringing the sales-to-new-listings ratio to 55.7%.
Ottawa Suburb West recorded a 56.2% sales-to-new-listings ratio and 3.0 months of inventory, the firmest absorption among the three suburban submarkets. Ottawa Suburb East recorded a 54.3% ratio and 3.0 months of inventory.
Conditions were softer in Ottawa Center, where sales fell 8.3% year over year. Its sales-to-new-listings ratio was 39.6%, with 5.6 months of inventory. Rural results were mixed: sales increased in Rural South and Rural West but declined in Rural East. Smaller transaction counts can make rural percentage changes more volatile.
What This Means for Buyers and Sellers
Ottawa Urban Realty commentary based on OREB’s July figures.
For buyers, the citywide inventory figures suggest there is still room to compare properties carefully. That opportunity is uneven: the apartment market has more supply relative to sales than the single-family or townhouse segments. A citywide headline is only a starting point for understanding a particular home.
For sellers, pricing and preparation remain important. With median selling time higher than a year ago, recent comparable sales and competing listings in your neighbourhood offer a more useful guide than applying the citywide average price change to your property.
Looking Ahead
July brought fewer new listings, lower active inventory than June and a stronger sales-to-new-listings ratio. Apartment conditions remained softer. As the market moves beyond the summer slowdown, the key question is whether sales continue to absorb available supply at a steady pace across different neighbourhoods and property types.
Planning a move? Contact Dan Moloughney at Ottawa Urban Realty to discuss the conditions affecting your neighbourhood and property type.
Source: Ottawa Real Estate Board, “OREB Market Update – July 2026,” issued August 6, 2026, including its accompanying charts and market summary graphic. Figures describe the Ottawa market covered by OREB’s report. Unless otherwise stated, annual comparisons are with July 2025. Graphics © Ottawa Real Estate Board. Market commentary is separate from OREB’s reported statistics. Citywide averages and benchmarks do not establish the value of an individual property.